1. Background introduction
In the real vehicle test, in addition to the perception algorithm, there are often other apps running at the same time, which squeezes the resource occupation of the algorithm, affects the model performance, and reduces the deployment effect. Therefore, in the early stage of the project to do the board verification, we can use some tools to pressure the CPU and memory, and then run the model to simulate the real car test, and get the performance data of the model when the hardware resources are limited, so that we have a good idea, timely adjustment and optimization, to avoid the late stage of the project to save performance costs and cut the model, the gain is not worth the loss.
The focus of this article is to introduce the stress-ng tool to developers and explore whether the tool can significantly affect the performance of the model, so that developers can do a good job of performance verification in non-real vehicle environments. For performance tuning of models or projects, refer to other excellent posts in the community. Due to the limited level of the author, if there are mistakes in the article, welcome to point out and communicate with each other.
2 Introduction to the development board pressure tool
2.1 Introduction to stress-ng
stress-ng can generate system load on linux. It can pressure the CPU, memory, and disk I/O. In addition, it has various compression strategies, such as floating point operation, integer operation, matrix operation, compression, and decompression, which can be used to test system stability under high load conditions.
Stress - ng tool making open source address is: GitHub - ColinIanKing/stress-ng: This is the stress-ng upstream project git repository. stress-ng will stress test a computer system in various selectable ways. It was designed to exercise various physical subsystems of a computer as well as the various operating system kernel interfaces.
2.2 stress-ng Compilation Description
1. First go to the github page of stress-ng and download the source code to our x86 server
2, the next source code compilation. Since our pressurized test environment is an arm development board, and the compilation process introduced by github is based on x86, we need to configure the environment variables to set up the cross-compiler to compile binary files that can be run on the development board, as shown in the following code:
cd stress-ng-0.17.06
export CC=aarch64-linux-gnu-gcc
make
3, after the compilation is completed, the executable file stress-ng will be generated in the folder where the source code is located, and it can be copied to the /userdata path on the development board.
2.3 stress-ng Usage instructions
2.3.1 Main Parameters
--cpu N: Let N cpus be fully loaded. N=0 will let all cpus be fully loaded
--cpu-load M: Collocation – CPU usage, occupying M% of the cpu load of N cores
--vm N: Enables N processes to occupy memory and continuously release and allocate memory
--vm-bytes N: specifies N bytes of memory used by all vm processes. The unit can be 1 MB, 1 GB
--vm-keep: The memory used by the vm process is not released
--timeout N: indicates the compression duration of N seconds. The unit can be 1s, 1m, 1h 1d. If this parameter is not configured, it is 1d
2.3.2 CPU Pressurization Method
CPU pressure command:
stress-ng --cpu 4 --cpu-load 90
Running the above command allows each of the four CPU cores to run at about 90% load.
2.3.3 Co-Pressurizing CPU and Memory (Recommended)
Execute the following command to pressurize both CPU and memory:
stress-ng --vm 2 --vm-bytes 2G --vm-keep
A vm of 2 will cause 2 CPU cores to run fully, a VM-bytes of 2 gigabytes will occupy 2 gigabytes of memory (regardless of the number of VMS), and adding VM-keep will keep memory occupied. This command can simultaneously pressure the CPU and memory, is a more recommended way, this article will also do performance tests based on this method.
3 Introduction to model performance evaluation tools
3.1 Introduction to hrt_model_exec
hrt_model_exec is a model execution tool provided by the Horizon Algorithm toolchain. The perf function of the tool can be used to evaluate the inference performance of the model on the development board. The complete introduction of the tool can be found in the user manual: https://developer.horizon.cc/api/v1/fileData/horizon\_j5\_open\_explorer\_cn\_doc/runtime/source/tool\_introduction/source/hrt _model_exec.html
This tool can be found in the ddk/package/board/hrt_tools/bin path of the OE package, which needs to be copied to the development board.
3.2 hrt_model_exec Usage Method
hrt_model_exec can evaluate a model’s single frame Latency in a single core, single thread, or the model’s throughput (FPS) in a dual core, multiple threads. Single frame delay reflects the time required for a single model to process a frame of data, and is an important index to measure the real-time performance of a computing platform. Here we chose to analyze the performance impact based on single frame delay, which is more stable than FPS. The reference command for evaluating the single frame delay of the model is as follows:
hrt_model_exec perf --model_file ./model.bin --frame_count 1000
frame_count默认为200,这里我们设置为1000,为的是让评估的数值更加准确。
4 Experimental Part
4.1 Experimental Ideas
In this paper, two models are used to analyze the influence of CPU and memory compression on single frame delay. The computing platform is J5. Big models use CenterPoint (from OE package/samples/DDK model_zoo/runtime/ai_benchmark/qat/centerpoint_pointpillar_nuscenes), Small models use Resnet18 (OE package ddk/samples/ai_toolchain/horizon_model_convert_sample/03_classification/03_resnet18 compiled in O3). The compression method was adopted in 2.3.3 “CPU and Memory Co-compression Method” in this paper to compare the impact of single frame delay of the two models.
4.2 J5 Hardware Resources Description
The J5 hardware resources involved in this experiment are briefly introduced here.
CPU: 8 x A55
BPU: The J5 has a dual-core BPU, but the performance tests performed in this article only use single-core BPU
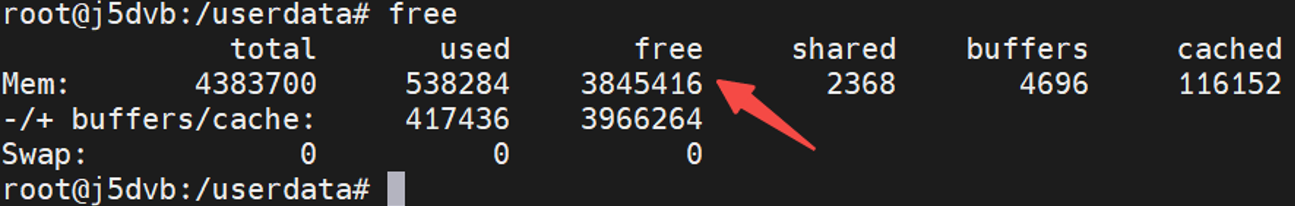
Memory: You can use the free command to view the memory allocation of the development board, when no user process is executed, the available memory is about 3.8G, see the following figure
4.3 Datas
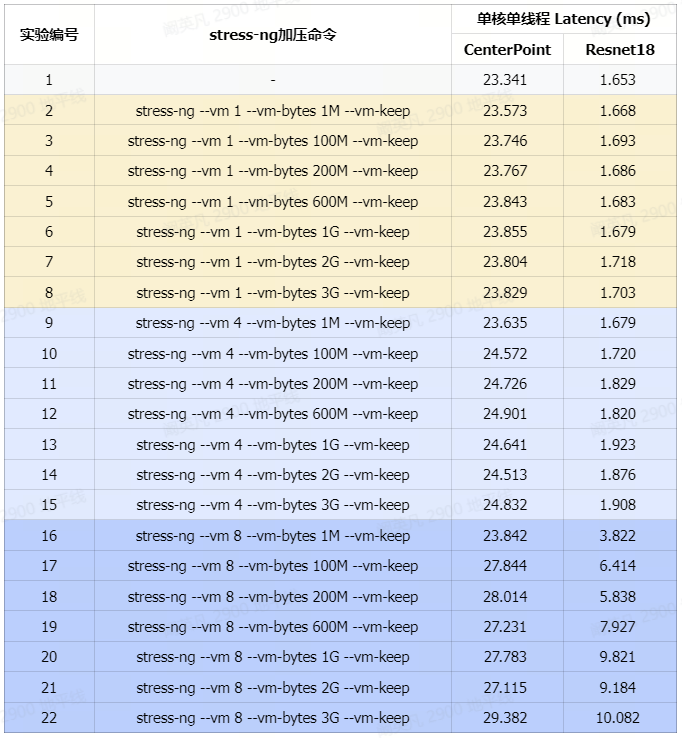
Experiment 1 is the single frame delay data obtained by running CenterPoint and Resnet18 separately without pressure.
Experiments 2-8 are the single frame delay data of memory occupation increasing sequentially when one CPU core is fully loaded.
Experiments 9-15 are the single frame delay data of increasing memory usage when 4 CPU cores are fully loaded.
Experiments 16-22 are the single frame delay data of the sequential increase in memory usage when all CPU cores are fully loaded.
CenterPoint and Resnet18 are tested separately and will not run simultaneously.
See below for a more intuitive line chart based on tabular information.
4.3.2 CenterPoint Line Chart
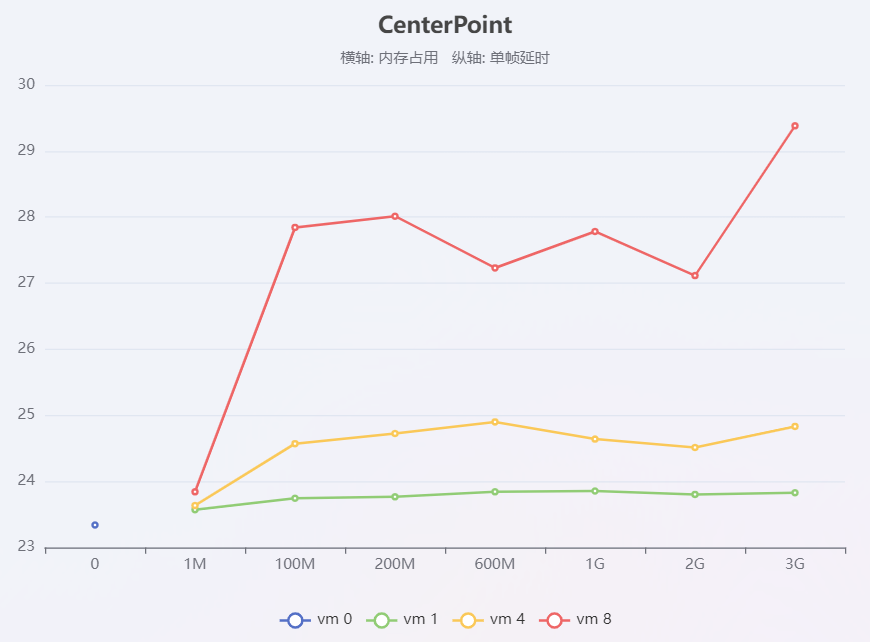
In the figure, the blue dots indicate CenterPoint’s performance when no pressure is applied, the green lines indicate CenterPoint’s memory usage increases in sequence when one core is fully loaded, the yellow lines indicate CenterPoint’s memory usage increases in sequence when four cores are fully loaded, and the red lines indicate CenterPoint’s memory usage increases in sequence when eight cores are fully loaded.
4.3.3 Resnet18 Line Chart
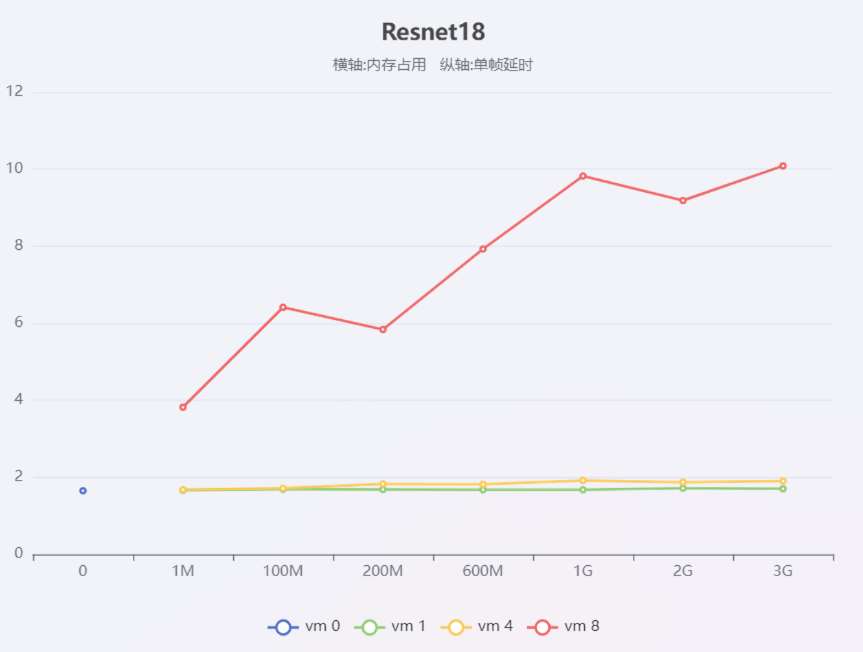
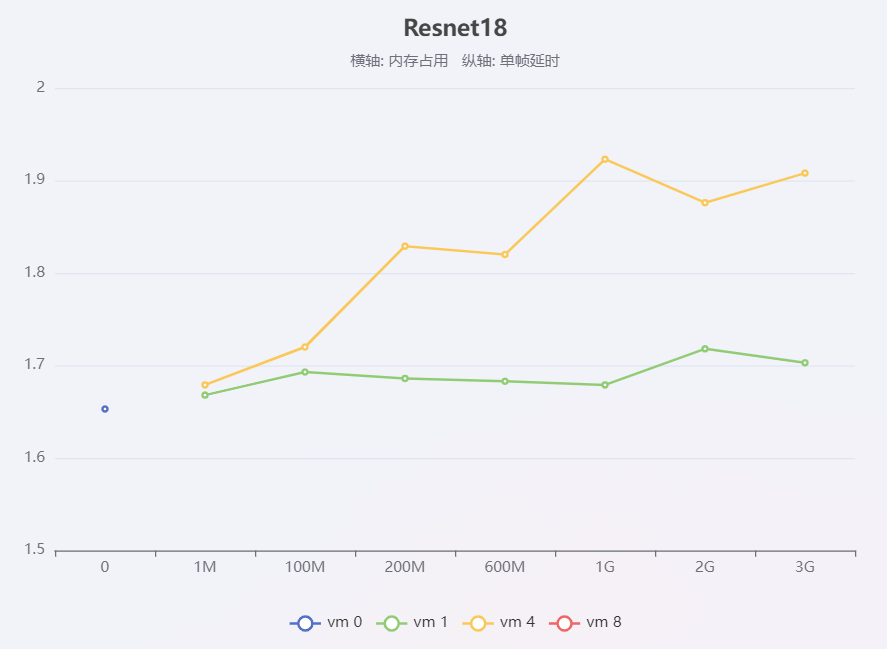
The reading method of Resnet18 line chart is the same as Centerpoint. Since the model performance degrades especially at 8-core full load (red line), the following figure is provided to conveniently see the performance changes at single-core full load (green line) and 4-core full load (yellow line)
5 Experimental Conclusions
The CPU and memory footprint of the stress-ng tool can significantly affect model performance.
The influence of memory compression on the single frame delay of the model is relatively small, and the influence of CPU compression is larger.
When the memory usage is the same, the higher the CPU usage is, the higher the single frame delay is.
When the CPU load is the same, the single frame delay of the model increases with the increase of memory usage.
When the CPU is fully loaded, the single-frame delay of the small model is much more serious than that of the large model.
6 Conclusion
This paper focuses on the stress-NG tool and proves through experiments that the stress of stress-NG on CPU and memory can significantly affect the performance of the model. This tool can facilitate developers to verify the actual running performance of the model when resources are limited.