To help users more quickly understand the use of precision debug analysis and the testing process, we provide three test cases here for users’ reference: MobileVit_s, repvgg_b2_deploy, and mnasnet_1.0_96. Among them: For mnasnet_1. 0 _96 analysis process please refer to: This article mainly uses precision debug tool to locate quantization accuracy problems of repvgg_b2_deploy. The repvgg_b2_deploy model tests classification accuracy on 50,000 images in the imagenet dataset. By default, the model accuracy is as follows:
Model name
architecture
floating point precision
Quantization precision
repvgg_b2_deploy
bayes
0.78788
0.71138(90.29%)
The accuracy of the fixed point model after quantization is not 99% of the floating point model, so the precision debug tool is used to locate the precision anomaly of the model.
1. Confirm the cumulative error distribution of individual quantized weights/activations
1.1 API usage
import horizon_nn.debug as dbg

dbg.plot_acc_error(
    save_dir='./',
    calibrated_data='./calibration_data',
    model_or_file='./calibrated_model.onnx',
    quantize_node=['weight', 'activation'],
    metric='cosine-similarity',
    average_mode=False
)
1.2 Result
From the analysis results, it can be seen that the quantization error of the model mainly comes from the quantization of weights.
2. Sensitivity ranking of weight calibration nodes
2.1 API usage
import horizon_nn.debug as dbg

node_message = dbg.get_sensitivity_of_nodes(
    model_or_file='./calibrated_model.onnx',
    metrics='cosine-similarity',
    calibrated_data='./calibration_data/',
    output_node=None,
    node_type='weight',
    data_num=None,
    verbose=True,
    interested_nodes=None
)
2.2 Result
In the model ownership recalibration nodes, the quantization sensitivity of top1 node is low, less than 0.99, and the other nodes are greater than 0.99.
3. Check the data distribution of the sensitive layer
3.1 API usage
import horizon_nn.debug as dbg

dbg.plot_distribution(save_dir='./',
                      model_or_file='./calibrated_model.onnx',
                      calibrated_data='./calibration_data',
                      nodes_list=['stage2.2.rbr_reparam.weight_HzCalibration',
                             'stage3.2.rbr_reparam.weight_HzCalibration',
                             'stage3.3.rbr_reparam.weight_HzCalibration',
                             'stage1.3.rbr_reparam.weight_HzCalibration',
                             'stage3.14.rbr_reparam.weight_HzCalibration'])
3.2 Output results
Node name
Data distribution
stage2.2.rbr_reparam.weight_HzCalibration
stage3.2.rbr_reparam.weight_HzCalibration
stage3.3.rbr_reparam.weight_HzCalibration
stage1.3.rbr_reparam.weight_HzCalibration
stage3.14.rbr_reparam.weight_HzCalibration
Data distribution: The judgment criterion of data distribution is whether it meets the normal distribution of good quantization. As long as there is only one obvious unimodal in the distribution, it is considered to meet the normal distribution, and it is not necessary to strictly meet the normal distribution. According to the above criteria, the data distribution of nodes in the table meets the normal distribution. Since the accuracy of the current model is reduced due to weight quantization, and the weight calibration nodes are all per-channel quantization, there is no per-tensor quantization risk, so it is not necessary to draw the box plot of node data.
4. Partially quantified performance test
4.1 API usage
import horizon_nn.debug as dbg

node_message = dbg.get_sensitivity_of_nodes(
        model_or_file='./calibrated_model.onnx',
        metrics='cosine-similarity',
        calibrated_data='./calibration_data/',
        output_node=None,
        node_type='weight',
        data_num=None,
        verbose=False,
        interested_nodes=None)
nodes = list(node_message.keys())
dbg.plot_acc_error(save_dir='./',
                   calibrated_data='./calibration_data/',
                   model_or_file='./calibrated_model.onnx',
                   non_quantize_node=[nodes[:1], nodes[:2], nodes[:3], nodes[:4],
                                      nodes[:5], nodes[:6], nodes[:7], nodes[:8],
                                      nodes[:9], nodes[:10], nodes[:11], nodes[:12],
                                      nodes[:13], nodes[:14], nodes[:15], nodes[:16],
                                      nodes[:17], nodes[:18], nodes[:19], nodes[:20]],
                   metric='cosine-similarity',
                   average_mode=False)
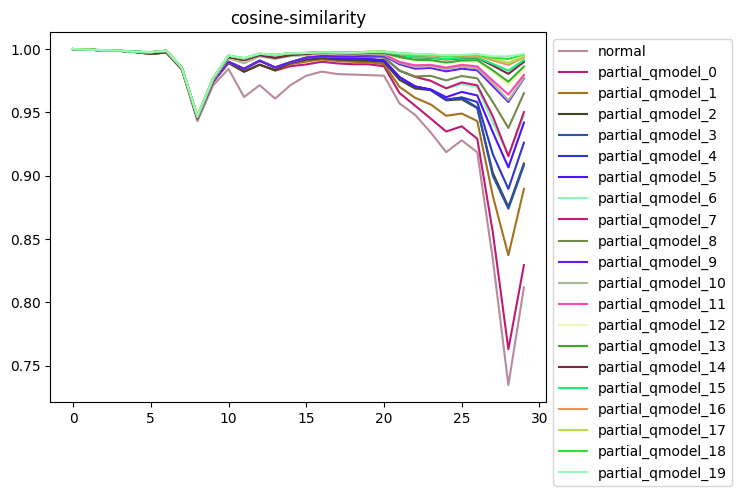
4.2 Test results
! Through partial quantization accuracy test, it is found that the model accuracy will be greatly improved when top14 weight calibration nodes are removed, and the accuracy will be slightly improved by continuing to increase the number of unquantized nodes. Therefore, on this basis, the partial quantization accuracy of the model is tested.
model
Quantization strategy
floating point precision
Calibration method
calibrated_model
repvgg_b2_deploy
default
0.78788
default_percentile_asy_perchannel
0.71138(90.29%)
repvgg_b2_deploy
Remove top14 weight calibration node quantization
0.78788
default_percentile_asy_perchannel
0.78004(99.00%)
repvgg_b2_deploy
Remove top15 weight calibration node quantization
0.78788
default_percentile_asy_perchannel
0.78252(99.32%)
5. Summary
5.1 Error cause analysis
- By using plot_acc_error in precision debug tool to analyze the cumulative error of quantization weights and quantized activated partial quantization models, it can be seen that quantization weights will lead to a decrease in the quantization accuracy of models.
- Through the analysis of node quantization sensitivity, it is found that only the quantization sensitivity of top1 weight calibration node is less than 0.99. By further drawing the data distribution of Top1 weight calibration node and the data distribution among channels, it is found that the data distribution is in line with the normal distribution that is friendly to quantization, and the data distribution between channels does not fluctuate much, so it can be concluded: The main source of model quantization error is the quantization of weights, and the decrease of quantization accuracy is mainly caused by the accumulation of errors at each node of the model.
5.2 Suggestions for improving accuracy
- Find the common node corresponding to the quantization sensitive weight calibration node and run it on the CPU.